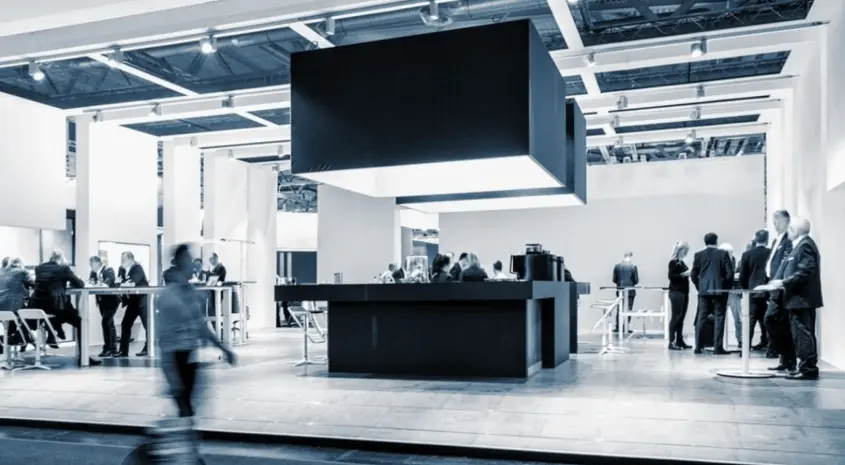
Trade shows are more than just setting up an eye-catching booth and waiting for the foot traffic to come. With ROI accountability and declining attention spans in the market, brands are leveraging data to optimize their strategies, specifically around exhibit design. The introduction of custom trade show exhibits also supplied requirements for more data around performance, engagement, and outcomes. Today, data informs decision-making and fundamentally alters the ways brands represent themselves on the convention floor.
Evaluating your booth performance against your competitors begins with a change in mindset. Exhibitors today see trade shows not only as a branding activity but also as a business function that is trackable, measurable, and demonstrable. Consequently there is even more onus on the display, irrespective of how well it is designed, to show and demonstrate value in terms of driving traffic, connecting (or reconciling connections), and converting interest into measurable outcomes.
Strategic Metrics That Make Booth Designs Smarter

1. Leverage Data to Compare Performance of New and Used Trade Show Booth Options
Choosing between new and used trade show booth set-ups goes beyond looks or budget—it’s about performance. Analyzing past trade show data can give you insights into how each format works when it comes to garnering leads and brand positioning.
For example, measuring the amount of time attendees spent in your booth, how many conversations took place, and the rate of lead capture can help ascertain which format produced better ROI. Creating a data-driven process can inform your decision a year or two down the line when you decide to replace your used setup with a custom-designed one.
2. Use Real-Time Foot Traffic Analytics to Optimize Layout
Contemporary exhibit designers leverage foot traffic analytics and booth behaviors. Using heat maps and tracking software, brands can learn where visitors are engaging and where they aren’t. These insights help in real-time adjustments (signage changes or shifting displays) during the event. The takeaways are tremendously valuable for future exhibits as well… and the resulting booth structure and design can align more closely with audience attention and movement and, hence, add valuable engagement.
This process can help to maximize area-usage capabilities, with every nook, cranny, and corner utilized to put eyeballs or feet on either engagement or branding. For example, if the exhibit contains product demonstrations to garner a large audience, it’s incredibly important to position those demos in a way that they can handle and streamline foot traffic without creating bottlenecks.
3. Track Engagement Beyond Headcount
Visitor numbers matter, but they rarely capture the full picture. Smart exhibitors understand that visitor count is not as impactful as deeper engagement metrics, such as time spent per visitor, questions asked, digital material downloaded, or social engagement with the booth. Engagement metrics can tell us not only that someone attended but also that the attendee was interested and connected. Many tools, such as QR code tracking, interactive screens, or lead scanning apps, can be useful for providing data that would inform the most impactful part of the presentation in terms of engagement.
When a brand learns about attention and attention span, it can ultimately create a blueprint for messaging, visuals, and layout at future shows.
4. Link Booth Data with Post-Event Sales Activity
The ultimate measure of success is whether or not activity in the booth converts to business. Make it a practice to connect booth data to your CRM systems as one way to track leads through all phases of the customer journey. The ultimate report would identify booth activity and relate it to action after the event. After the show, capturing actions, such as email responses, meeting bookings, or conversions into a sale, provides a greater understanding of overall performance. This will also support calculating the customer acquisition cost per show and support improved forecasting for future events.
Some organizations might take this a step further by tagging leads based on booth behavior, allowing the sales team to understand how to tailor follow-up touchpoints and ultimately close the business.
5. Benchmark Against Industry Standards to Refine Long-Term Strategy
To be of value, data needs to provide context. Putting the performance metrics for your exhibit into context with industry averages or competitor benchmarks will help you identify relative strengths and weaknesses. Are you generating a greater number of leads than average for your booth size? Are your dwell times the same, shorter, or longer than similar exhibitors?
Providing a contextualization of the data helps you justify your investment, make modifications to your future strategy, and set achievable performance targets for your next trade show presence. For many industries, acquiring these benchmarks is now easier than ever, with event organizers and third-party data aggregators offering post-show analytics reports.
End Point
Intelligent data drives intelligent design. When careful metrics are applied to the evaluation of the exhibition booth—measuring everything from visitor behavior to lead acquisition—businesses can turn their trade show costs into future brand assets.
